Stock market trend of 2024 and Impact of Uranus, Neptune and Saturn

Stock Market trend of 2024

Stock Market trend of 2024

Introduction 

As we enter the year 2024 in stock market world , investors and traders around the world are eagerly anticipating the stock market trends of 2024 i.e whether we have bull rally or bear rally unlike in year 2023 when Indian Stock market has seen rapid growth in Sensex, Nifty and other indexes and  many of investors and traders are seeking insights into potential opportunities and risks in the year 2024 as well. While financial analysis and economic indicators play a crucial role in understanding market behavior, some individuals also turn to astrology to gain an alternative perspective on the stock market’s future trajectory.

What is Stock Market Astrology 

Stock market astrology is a fascinating field that combines the principles of astrology with financial market analysis. This unique approach posits that the movements of celestial bodies can influence stock market trends, offering investors additional insights into market behavior.One of the primary benefits of stock market astrology is its potential to offer a different perspective on market trends. It can serve as a supplementary tool for investors, helping them make more informed decisions. However, it is essential to acknowledge that stock market astrology is not a science and should be used with caution. Relying solely on astrological predictions without considering traditional financial analysis can be risky.

Summary of Stock Market astrology Trend in 2024 : India & World 

The stock market trends of 2024 are predicted to bring significant shifts and fluctuations, with the beginning of January month being a key time for these changes. Astronomers and financial experts believe that Jupiter’s momentum and speed will be linked to economic upheavals and inflation challenges, particularly during March 2025 and that will continuously bring fluctuation in market up to October 2024  from April 2024 after Jupiter change in momentum and the transit in the taurus sign , as soon Saturn moves closer to Neptune in a bearish Pisces sign.

Several major planetary alignments, geopolitical issues, US treasury issues, India and US elections Red Sea conflict, Israel-Palestine war, and Russia & Ukraine war challenge can also influence market trends during this period. Saturn’s transit through Aquarius is expected to have a substantial impact on the stock market, with strong growth in sectors such as IT, software, technology, space communication, and automobile industry. However, investors should exercise prudence and avoid disregarding potential hazards, as manipulation may be involved in stock investment.

Uranus’s transit in Aries is anticipated to cause disturbances and unforeseen alterations in market trends, particularly in sectors like banking, finance, healthcare, fintech, and real estate industry. Neptune’s presence in Pisces with Rahu can lead to increased volatility and free fall and possibility of bear momentum in the stock market during April, May, and June 2024 before Jupiter and Saturn retrograde momentum from 29th June and October 9th 2024 . This combination can result in an elevated feeling of idealism, creativity, and spiritual development, but can also lead to a downward trend in the stock market but with stability also. Positive point is this year we may see aggressive growth in commodity market specially in rare metals like Gold and Silver etc.

The psychological impact of Neptune’s presence in Pisces and Rahu can also have a significant impact on investors and traders due to upcoming volatility and free fall could be linked with geopolitical issues. This could lead to a sense of false hope or unrealistic expectations, urging caution and thorough research before making any investment decisions.

The stock market in 2024 is influenced by various factors, including the astrological configuration of Uranus as. Uranus, often associated with invention and unpredictability, can cause significant changes and disturbances in various aspects of life, including financial markets. In 2024, Uranus is predicted to be in the Aries and Taurus sign after Jupiter Momentum in taurus sign  which is associated with growth, stability, and material wealth gain. This location may seem paradoxical, but it could lead to unforeseen fluctuations in sectors like technology, finance, and innovative businesses.

Uranus’ disruptive energy often brings unexpected and volatile shifts to the stock market, signaling periods of significant upheaval, both positive and negative. Its influence on the financial world is associated with financial innovation, technological advancements, and disruption of traditional financial systems. With the rise of fintech, Uranus has played a crucial role in shaping digital payments, cryptocurrencies, and blockchain technology. However, its energy can also lead to financial instability and unpredictability, leading to market bubbles and financial crises if not managed carefully.

Uranus affects the global economy by bringing about significant shifts in economic systems, trade agreements, and geopolitical dynamics. Its revolutionary energy often challenges the status quo and encourages innovation in economic policies and practices. However, it can also create economic disruptions and social unrest, necessitating proactive measures and adaptive strategies to mitigate their negative impacts.

Since April 2023, the Indian stock market has experienced significant growth, with the Sensex, Bank Nifty, and Nifty 50 experiencing a reverse trend. The Indian Sensex has crossed the 60,000 mark, an unprecedented achievement in history. However, the market has experienced a fall due to affliction on Uranus and Jupiter in Aries. Rahu, an expensive planet, is in a bull sign, and Jupiter is in a retrograde motion. The market may reach its highest point when Rahu shifts from a bull to a bear sign in Pisces, and Jupiter transitions from a stationary retrograde to a stationary state.

The market will shift its direction from December 31st to January 19th, 2024 and later we may see during April, May and June month as well, when it will be in a stationary direct state of 11 degrees in Ashwani Nakashtra to journey from Aries to Taurus sign in Kritika Nakshatra in year 2024. Jupiter will move to the earthy sign of Taurus in Kritika Nakashtra from May 2nd 2024, providing strength to the bank sector. Uranus is a significant factor in financial developments, market rise and fall, and inflation issues. When Uranus is in a bear sign, it can cause market values to rise and generate flutters.

The bank, PSU’s. Sensex, and Nifty will continue to be in a healthy position until Uranus is in conjunction with Jupiter in the Aries & Taurus sign in April, May, June and July 2024. The market may experience adjustments at the beginning of the following month due to the conjunction between Rahu and Neptune, as well as the 22-degree arc with Pluto and Saturn.

Astrology can have a psychological impact on investors, influencing their confidence and decision-making process. It can also impact market sentiment, leading to buying and selling decisions that align with predictions. Astrology can also serve as a risk management tool, highlighting potential market volatility or unexpected events. The combined energy of Uranus, Neptune, and Saturn can significantly influence stock market, geo-politics, financial world, and global economics in 2024. While it can create volatility and uncertainty, it also offers opportunities for innovation and growth. Astrology should be approached with a balanced perspective, considering other factors contributing to the complexities of financial and economic systems.

For the details analysis part lets move toward  following sections to understand in-depth impact of the stock market scenario for this year 2024.

The Stock Market Trend of 2024 : General Astrological Perspective and Rules for Stock Market analysis


stock market and financial astrology upscaled 1 Stock market trend of 2024 and Impact of Uranus, Neptune and Saturn


According to many astrologers and the financial experts, the year 2024 is expected to bring significant shifts and fluctuations in the stock market with the beginning of January month as soon as Jupiter will gain it’s momentum and speed and cover the distance toward Uranus, which is majorly linked with economic upheavals and inflation challanges that global market will going to see in near future specially during March 2025,once Saturn will move more closer toward Neptune in bearish Pisces sign. Several key planetary alignments, India and US Parliamentary elections upcoming Geopolitical issues and US treasury issues, Red Sea conflict , Israel- Palestine war, Russia & Ukraine war challenge can be believed to influence market trends during this period.


The Impact of Neptune, Uranus and Saturn in Stock Market  in 2024


A Look at Stock Market Astrology, the Financial World, and World Economics

Below are major Planetary alignments or placements which can have a strong impact on the Stock market sentiments and we can see regular corrections as well as gain too in the Stock market before April 2024.

  1. Saturn in Aquarius : The transit of Saturn through Aquarius is believed to have a substantial impact on the stock market in 2024 as soon Saturn will leave its Nakashtra placement from Satabisha to Poorvabhadra.Saturn Satabisha Nakashtra stay has given strong growth in the IT, Software industries, Technology, Space Communication, & Automobile industries. There is a strong claim that this celestial alignment may result in heightened market volatility and unpredictability due to the forthcoming alterations in the saturn nakshatra post April 2024. Investors must anticipate abrupt fluctuations and exercise prudence in their decision-making process from mid of January to 2nd June 2024.During this tenure Both Saturn & Jupiter will move aggressively and gain their respective speeds and momentum which can strongly influence decision making of the investors and traders and we can see strong volatility and instability as well.
  2. Jupiter in Aries and Taurus : there will be a major shift of Jupiter’s transit from Aries to Taurus around endings May and in the beginning of June : Jupiter’s placement in the Aries is thought to create a sense of positivity and growth to the market due to its strong planetary alignment with the North node Rahu and Uranus in a bull sign. This alignment has given potential to result in growth opportunities, namely in sectors associated with spirituality, treasury , Finance sector, Fintech technology companies, Banking,and healthcare etc. Nevertheless, investors should use prudence and refrain from disregarding potential hazards as there was manipulation also involved in stock investment.
  3. Uranus in Aries : The transit of Uranus in Aries is anticipated to cause disturbances and unforeseen alterations in the market trends in near future when Jupiter will be closer toward the Uranus around May & June 2024 , It can cause challanges in global economy and inflation particularly when it is influenced by Jupiter in the upcoming period.Investors are advised to anticipate abrupt fluctuations in sectors such as banking, finance, Healthcare, Fintech and real estate sector. Being flexible and adaptable nature will be crucial for successfully navigating these changes.
  4. Neptune in Pisces with Rahu : Rahu, the North Node of the Moon, is known for its ability to create sudden and unexpected events especially when it is aligned with Bearish planets like Mars, Saturn & Mercury. It also represents desires, ambitions, and worldly attachments. When Rahu is in Pisces, it will intensifies Neptune’s influence, amplifying the potential for illusion and confusion. This combination of Neptune and Rahu can lead to increased volatility in the stock market during the month of April, May & June 2024.
  5. Investors may find it challenging to predict market trends accurately, as the influence of Neptune blurs the lines between reality and speculation. This can result in sudden market swings and increased uncertainty. The presence of Neptune in Pisces with Rahu signifies the conjunction of the planet connected with dreams, illusions, and spirituality. It symbolizes the abstract elements of existence and motivates us to access our intuition and imagination.
  6. Pisces, being a water sign, is renowned for its profound emotional capacity, empathy, and susceptibility. During the transit of Neptune through Pisces, in conjunction with Rahu and forming a 30-degree arc with Saturn, the traits of both the planet and the sign can be intensified, resulting in both positive and bad effects in Market sentiments and the geopolitical issues. This combination can result in an elevated feeling of idealism, creativity, and a longing for spiritual development, but it can also lead to a downward trend in the stock market. Nevertheless, it can also result in perplexity, deceit, and a proclivity to evade reality in the interconnected world.

Upcoming Psychological Impact on Investors & Traders in Stock Market

Neptune’s presence in Pisces along with North node Rahu can also have a strong psychological impact on the investors & traders due to upcoming volatility that can be visible in the month of April & May 2024, initial signal we can start assuming from March 2024. The heightened sense of idealism and desire for spiritual fulfillment may lead some investors to make decisions based on intuition rather than rational analysis. While intuition can be a valuable tool, it is essential to strike a balance between intuition and sound financial judgment.

Additionally, the illusionary nature of Neptune can create a sense of false hope or unrealistic expectations. Investors may be tempted to chase after quick gains or invest in speculative ventures without fully understanding the risks involved. It is crucial for investors to exercise caution and conduct thorough research before making any investment decisions.

Impact of Uranus Transits in Aries and Taurus in Stock Market trend of 2024


impact on stock market by uranus upscaled Stock market trend of 2024 and Impact of Uranus, Neptune and Saturn


When considering the stock market in the year 2024, it is crucial to take into account the diverse aspects that can impact it. An influential aspect that can affect market patterns is the astrological configuration of the planet Uranus. Although astrology is not a typical means of studying the stock market, it is intriguing to investigate the potential influence of celestial bodies on financial markets.

Uranus is frequently linked to invention, alteration, and unpredictability in the field of astrology. It symbolizes the innate longing for liberation and the aspiration to defy conventional standards. When Uranus aligns with specific astrological aspects, it has the potential to cause substantial changes and disturbances in different parts of life, including the financial markets.

Although astrology should not be relied upon as the main determinant for investment decisions, several analysts argue that the alignment of Uranus might offer valuable insights into possible patterns in the stock market. Uranus is renowned for its disruptive force, and when it aligns with other celestial bodies or major points in the astrological chart, it can signify periods of instability and unforeseen fluctuations in the market.

In 2024, Uranus is forecasted to be positioned in the astrological sign of Aries which is commonly connected with Fire element, Bull trend, growth , stability and material wealth gain with hook and crook . This location may appear paradoxical, given Uranus’s reputation for its capricious disposition. Nevertheless, the conjunction of Uranus in aries has the potential to cause unforeseen fluctuations in financial markets, namely in sectors such as technology, finance, and inventive businesses.


The Influence of Uranus, Neptune & Saturn on Stock Market Astrology trend of 2024

Uranus, with its disruptive energy, often brings unexpected and volatile shifts to the stock market. As an outer planet, its influence is long-lasting and can span several years. When Uranus aligns with key points in an astrological chart related to the stock market, it can signal periods of significant upheaval, both positive and negative.

During Uranus transits, we often witness sudden market crashes or booms, as well as the emergence of new industries and technologies. These shifts can create both opportunities and challenges for investors and traders.

Role of the Uranus and the Financial World in Stock Market Astrology

In the realm of finance and Stock Market Astrology , Uranus is associated with financial innovation, technological advancements, and the disruption of traditional financial systems. It often brings about changes in the way we handle money, invest, and conduct financial transactions.

With the rise of financial technology, or fintech, Uranus has played a crucial role in shaping the landscape of digital payments, cryptocurrencies, and blockchain technology. These innovations have the potential to revolutionize the financial world, offering greater efficiency, transparency, and accessibility.

However, Uranus’ influence can also lead to financial instability and unpredictability. Its energy encourages risk-taking and speculative behavior, which can result in market bubbles and financial crises if not managed carefully.

Uranus, Outer Planets and Impacts on the global Economical challenges : Global Stock Market


On a broader scale, Uranus affects the global economy by bringing about significant shifts in economic systems, trade agreements, and geopolitical dynamics. Its influence can be seen in the rise and fall of nations, the emergence of new economic powers, and the reshaping of international alliances.

Uranus’ revolutionary energy often challenges the status quo and encourages innovation in economic policies and practices. It can lead to the adoption of progressive economic models, such as sustainable development, green technologies, and social entrepreneurship.

At the same time, Uranus can also create economic disruptions and social unrest, particularly when sudden changes in economic structures lead to job losses, income inequality, or financial instability. These shifts require proactive measures and adaptive strategies to mitigate their negative impacts and ensure a smoother transition.

Uranus, Neptune, Jupiter and Rahu Planetary alignment and Stock Market astrology trend of December 2023 – January 2024


Stock Market trend of 2024

Stock Market trend of 2024

Following Jupiter’s transition from retrograde to direct motion on December 30th, we anticipate a shift in momentum and a continuation of the bullish trend until mid-January 2024, at which point it is likely to become bearish. Despite Jupiter’s presence in a bullish sign alongside Uranus, it will contribute to an upward movement in the market.
The conjunction of Nodes (Rahu/Ketu) with Neptune and Saturn, together with a 30-degree angular difference with both Neptune and Pluto, can potentially trigger geopolitical tensions along the maritime route, particularly in the vicinity of the red sea.
Currently, we are observing Mars exerting an influence on the North nodes, which has caused some stress and tensions in the sea route. Additionally, there will be a significant alignment in Sagittarius in January, specifically after the 10th of January 2024. This alignment is expected to strongly impact the USA chart, leading to a sudden change in trend after mid-January 2024.
It is possible that the bearish trend may become more positive in January and February due to the increased speed of Saturn, which occurs when it moves with the sun.

If we look into more deeper level approach uranus is currently in a bull sign, along with Jupiter in a fiery sign (Aries in Bahrani and Ashwani Nakshatra) around 11 and 25 degrees. Both of these signs are in the sign of the bull. The Venusian sign of Bharani is a Nakashtra that is known for its transforming qualities. Since the beginning of April 2023, we have witnessed a substantial increase in the values of stocks as well as an overall increase in the Sensex, Bank Nifty, and Nifty 50.

The market has shown a reverse trend, and we have seen consistent growth in both the Nifty and the Sensex. Additionally, the Indian Sensex has crossed the barrier of 60,000, which is something that is very unusual in nature, and I have never seen the Indian market have crossed this mark in history ever.

This is something that I have never seen before. Nonetheless, in my initial observation earlier, it had to give a fall in the Sensex in a long-term trend due to affliction on Uranus and Jupiter in Aries. Rahu is an expensive planet, and its basic nature is amplification. In the bull and fiery signs, the market has shown a reverse trend.

At the same time when Jupiter and Uranus are in retrograde motion, Rahu is required to remain in the bull sign until October 31, 2023. All of the records have been broken up until this point, and it is possible that the market will reach its highest point for the first time once Rahu shifts from the sign of bull to the sign of bear in Pisces and Jupiter transitions from the stationary retrograde to the stationary state. This will be followed by a period of direct movement beginning on December 30, 2023, and continuing until it reaches its stationary degree of 11 around December 13, 2023. At this point, the market will have completely broken all of the records.

Now the market will shift its gear from 31st December 2023 onward to 19th January 2024 when it will be in stationary direct state of 11 degree in Ashwani Nakashtra and Nakshtra lord ketu already moved to the Virgo sign ( again bear sign ) from the Libra which is considered as Airy and and volatile and as per observation it has seen first market usually pick it’s speed and break all the records high in Bull state ( specially banks stocks ) and later once Jupiter picked it’s speed from stationary direct to direct and will move its 1 degree ahead from 11 degree there will be change in the market direction from 19th January 2024 onward and once sun move closer to Saturn and the Jupiter in Aquarius and aries sign we can have market direction from bull to bear state probably around this period.

While its initial results can be seen after January 26th onward when Uranus will move to its stationary direct state and later on from March/April and May 2024 onward we can have more probability of market direction will change from top to bottom as the same time we may have semi sextile aspect (30 degree) between Saturn and Pluto and further Neptune will also move closer towards the Rahu as well in the Pisces sign which is also a bear sign and it gives mixed results, both fall and rise.

Jupiter will move to the earthy sign of Taurus in Kritika Nakashtra as well, which will further provide strength to the bank sector. The good thing about this period is that the bank will resist its state and it will still go up because of the Saturn movement in Jupterian Nakashtra later in April 2024. Additionally, Jupiter will move to the sign of Taurus in Kritika Nakshatra, which will also support the bank sector.

Whenever Uranus is in a bear sign and in affliction, it has a tendency to jolt the market and issues that are related to the financial sector.

Uranus is the significator of unseen and unexpected developments in the world, particularly in matters pertaining to finances, market rise and fall, and issues relating to inflation. This is the explanation behind this.In the same way as Saturn does, it also causes market values to rise, and it even generates flutters due to the fact that it behaves in an uncertain manner. Additionally, it brings about sudden shifts in wild variations in the procedure while they are in ailment and in bear indications.

When Uranus has a partnership with two expanding planets like Rahu and Jupiter, the market might suddenly become bullish in bull signs like Aries, Leo, and Sagittarius. This can happen when the market is connected to Uranus.

When taken as a whole, we are able to assert that the bank, together with the sensex and the Nifty, will continue to be in a healthy position until such time as Uranus is in conjunction with Jupiter in the sign of Aries in April and May of 2024.

solely a competition We are able to recognize the issue as a result of the conjunction between Rahu and Neptune, as well as the 22-degree arc with Pluto and Saturn. Additionally, as a result of this additional assignment forming in bear signs, we may observe some adjustments at the beginning of the following month.

Let us keep our fingers crossed that the Indian market will act in a positive manner during the approaching geopolitical wars that could break out at any point between March and April of 2024 for any reason.

Related Article :

Mercury Retrogression and Effect on Stock Market and Commodities trading

Mercury Retrogression and Effect on Stock Market and Commodities trading ( 31st October to 21st November 2019)

The Impact of Astrology on Stock Market Decisions in 2024


stock market Stock market trend of 2024 and Impact of Uranus, Neptune and Saturn


It is important to note that astrology should not be the sole basis for making investment decisions. While astrological insights can provide an additional perspective, they should be used in conjunction with thorough financial analysis, market research, and consultation with financial advisors.

1. Psychological Impact: Astrology can have a psychological impact on investors. Believing in certain astrological predictions may influence their confidence and decision-making process. Positive or negative expectations based on astrological insights may lead to self-fulfilling prophecies in the market.

2. Market Sentiment: Astrological predictions can also impact overall market sentiment. If a significant number of investors believe in certain astrological forecasts, it may influence their buying and selling decisions, leading to market movements that align with those predictions.

3. Risk Management: Astrology can serve as a risk management tool by highlighting potential periods of market volatility or unexpected events. Investors who are aware of astrological forecasts can take precautionary measures, such as diversifying their portfolios or adjusting their investment strategies accordingly.

Conclusion

Over we can say with the combine energy of Uranus, Neptune and Saturn with their transformative energy, it can plays a significant role in mundane and financial astrology in year 2024, particularly in relation to the stock market, Geo-politics, the financial world, and global economics. Its influence can bring about sudden changes, both positive and negative, in these areas.

While Uranus can create volatility and uncertainty, it also offers opportunities for innovation, growth, and progress. Understanding its influence can help investors, financial institutions, and policymakers navigate the ever-evolving landscape of the stock market, the financial world, and world economics.

As with any astrological analysis, it is important to approach it with a balanced perspective, considering other factors and variables that contribute to the complexities of the financial and economic systems. Astrology can provide insights and guidance, but it should not be the sole basis for decision-making.

Reference, Links and Resources :

https://www.tradingview.com/script/zkXTcBZi-Financial-Astrology-Uranus-Harmonics/

With Best Regards,

Rocky Jamwal

pin Stock market trend of 2024 and Impact of Uranus, Neptune and Saturn

Views: 1913

Trading Alert in Stock Market : Saturn & Mercury Stationary Motion would possibly bring a sudden short-term bearish trend in the Market from 3rd June to 11th June 2022 onward 


Trading Alert in Stock Market

Trading Alert in Stock Market : Saturn & Mercury Movement will bring change in Trends for the coming 10-12 Days

Introduction

Within the context of the global stock market, the week beginning June 3 and ending June 15 brings with it a great deal of unpredictability, a wide range of possibilities, and a variety of investment openings. Primarily, we notice an effect on the stock markets in the United States and India. There is a good chance that the upcoming planetary movement will bring about some interesting developments in the world of finance. This is due to the fact that two significant celestial shifts are going to take place: first, Saturn will enter into a retrograde stationary state beginning on June 5th, and Mercury will go into a stationary direct state beginning on June 3rd and continuing forward. Mercury’s ongoing stationary direct state and Saturn’s retrograde state will have an effect on a variety of commodities related to crude oil, gas, coal, iron, IT, telecom, technology, and financial institutions; it is possible that either there will be an increase in stock prices or there will be chances of a sudden slash in prices of these commodities being seen in the business world as well. Saturn’s retrograde state will remain in effect until the end of the year.


Trading Alert in stock market

Actual Events of Stock Market 

During this stationary motion of slow-moving Saturn and fast-moving Mercury from June 3rd, 2022 onward, both will form an angle of 89 degrees to each other, which will completely change the ongoing short bullish trend towards downward starting from May 23rd, 2022 onward (as already mentioned in my earlier tweets for the short and temporary bullish trend we will see from May 23rd, 2022 onward after Venus movement over the Aries sign).

There will be a sudden shock, break, and fear factor that will apply to the ongoing trend of the stock market. There is a high chance that we can start observing a new bearish trend from June 3rd, 5th, and 6th, onward up to June 11th, 2022. This is because these changes in the celestial sphere will result in fast and slow-moving planets attaining stationary motion.

As the earlier Venus Movement in the Bullish Sign from May 23rd onwards has given a sudden boost or kick in the market’s upward trend, but more Venus will move towards Uranus in Aries around 22 degrees, and there is also a great chance of a sudden upset or sudden bearish trend in the financial world that may begin from June 11th and 12th, though it will be for a shorter period,

Later on, when Venus reaches the degree occupied by Uranus, which is 22 degrees, its passage towards the North Node Rahu will once again produce an upward trend beginning on the 15th of June, 2022, but this time it is possible that this trend will be a shorter one.

The Russia-Ukraine geopolitical situation has already produced inflation in the market over the course of the past two to three months as a direct result of Uranus’s close movement towards North Node Rahu.

The beginning of a pattern in trade

The upcoming shift in trend (from June 3rd to June 11th and 12th, 2022) will be favourable for the information technology sector, telecom, financial institutions, trading sector, and infrastructure stocks, and it will boost the good cash flow in the market. On the other hand, price increases will be observed in steel, crude oil, gas, leather, metal, and other commodities.

People can start observing or investigating the ongoing trend on the 3rd of June 2022, which I have posted on the Twitter :

https://twitter.com/jamwal_rocky/status/1532601400873476096?s=20&t=Xb0-ZAfeDuCGJlEIEc8riw :


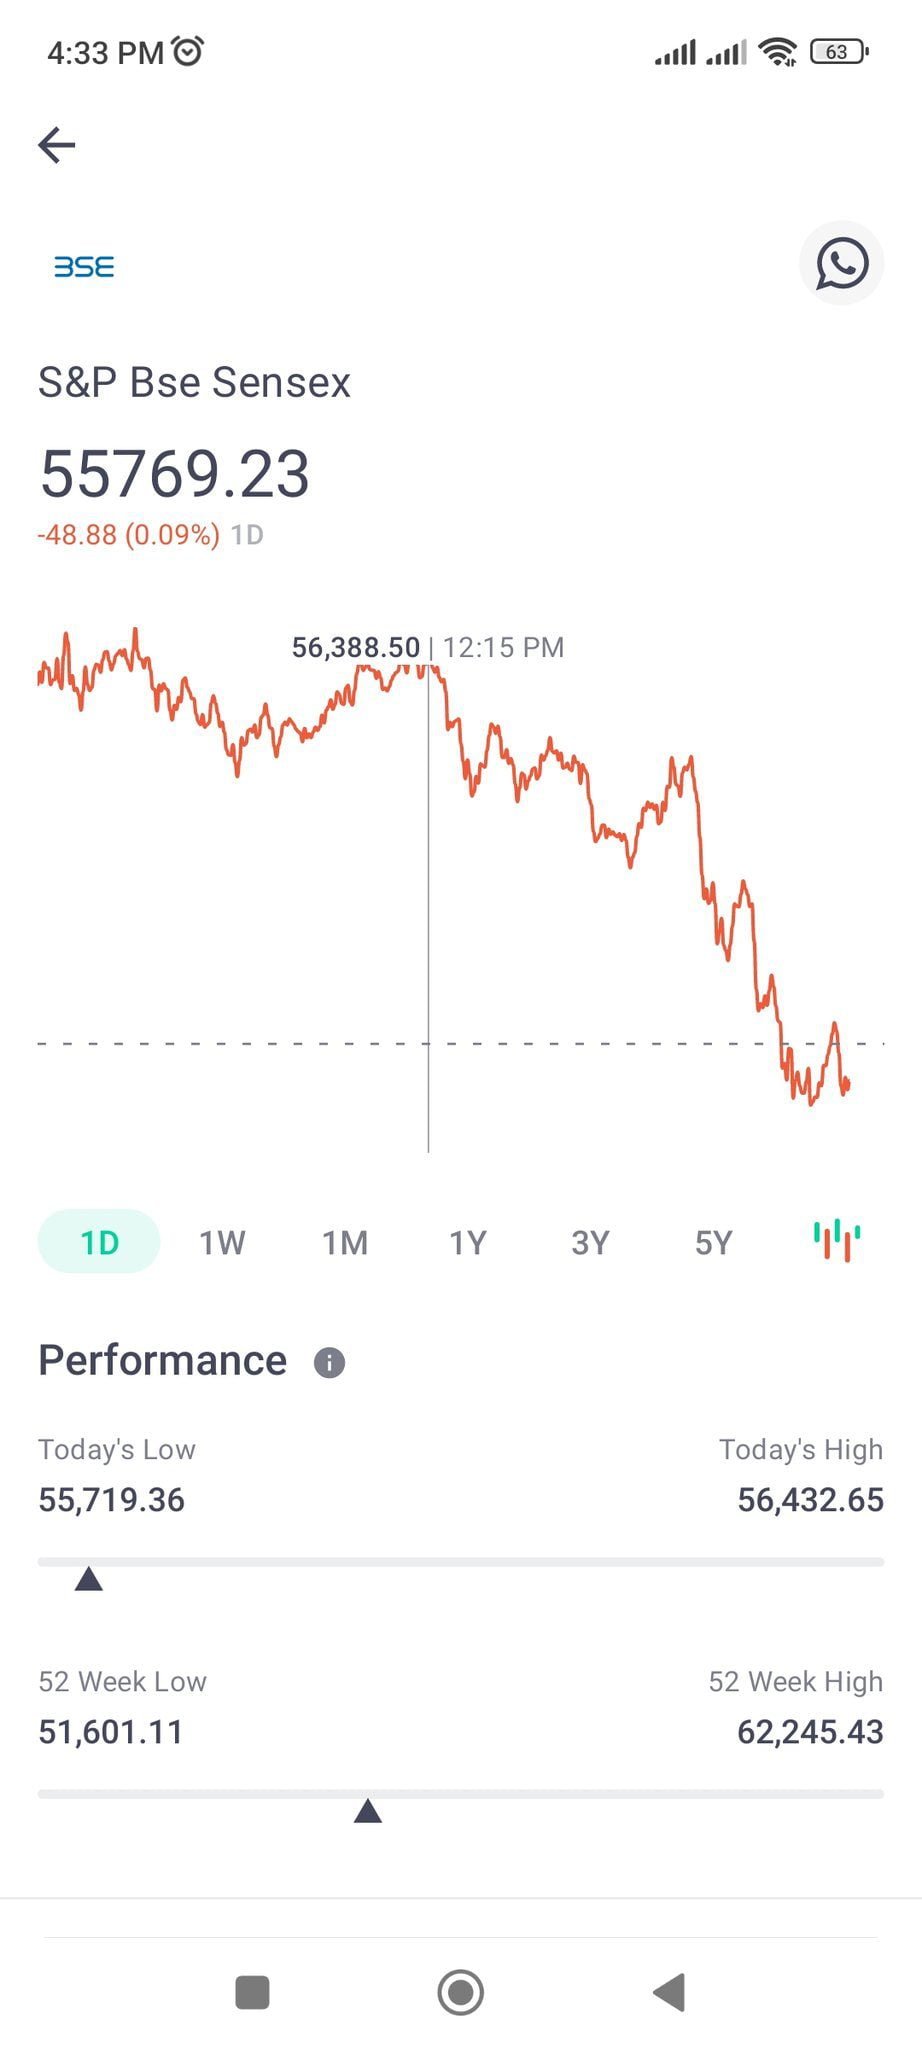
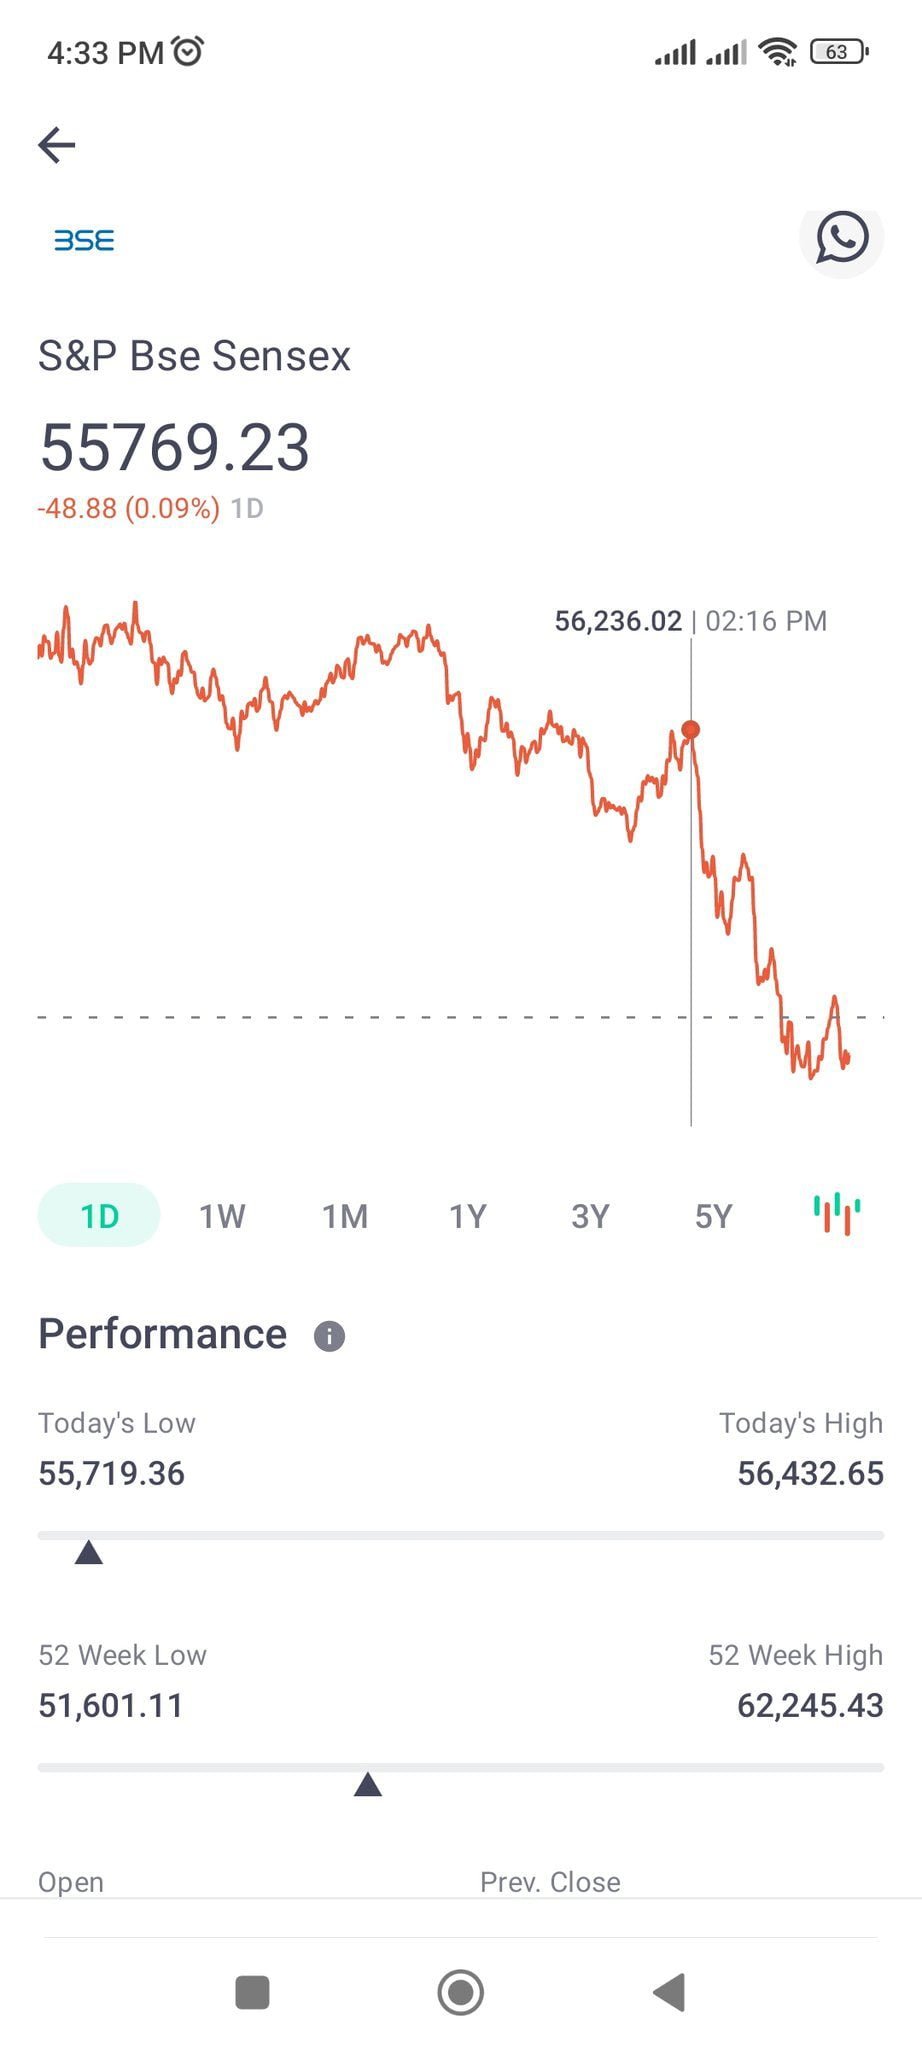
” From Morning 9:15 Onward Buying will be high & Selling/Buying both will be seen high from 12:30 Noon onward Today & Sudden Kick will be observed from 2:15 PM up to 3:30 PM. whereas The period from 2:15 is very crucial for Selling “

After observing the whole day, the Majority of the timings and stock information fall true.

Here are screenshots attached for reference :

Timing 1 Trading Alert in Stock Market : Saturn & Mercury Stationary Motion would possibly bring a sudden short-term bearish trend in the Market from 3rd June to 11th June 2022 onward 

timing2 Trading Alert in Stock Market : Saturn & Mercury Stationary Motion would possibly bring a sudden short-term bearish trend in the Market from 3rd June to 11th June 2022 onward 

So in the end, I can only conclude: Keep on observing the coming 10 days for new trends that can affect the ongoing short bullish trend.

Regards,

Rocky Jamwal.

pin Trading Alert in Stock Market : Saturn & Mercury Stationary Motion would possibly bring a sudden short-term bearish trend in the Market from 3rd June to 11th June 2022 onward 

Views: 43

Determining US Stock Market and Economic Recession Cycles Using Annual Lunar Calendar Chart Method

ivb8gldo image 625x300 14 July 22 1 Determining US Stock Market and Economic Recession Cycles Using Annual Lunar Calendar Chart Method

Determining US Stock Market and US Economy Recession Cycles Using Annual Lunar Calendar Chart Method

Article Researched, Written, and Shared by Rao Nemani

Compiled by Rocky Jamwal


Introduction to US Stock Market and Recession Cycle 

As per the us stock market analysis and National Bureau of Economic Research, a recession is defined as “A significant decline in economic activity spread across the economy, lasting more than a few months, normally visible in real GDP, real income, employment, industrial production, and wholesale-retail sales”. Americans have experienced these recession cycles in the past many years in USA, but most importantly, the business and working class people are effected by the Corporations spend  and downsizing of workforce / resources during the recession time. So, in this paper, I would like to share a method to determine USA Recession Cycles using Annual Lunar Calendar Chart casted by taking the Capital city of the USA, Washington, DC. 

The US stock market is a cornerstone of the global financial system, providing a platform for trading securities and acting as a barometer of overall economic health. Its roots date back to the late 18th century, when the New York Stock Exchange (NYSE) was founded in 1792. Today, the NYSE is one of the world’s largest stock exchanges, along with other major US exchanges such as NASDAQ. These exchanges facilitate stock buying and selling, acting as intermediaries between buyers and sellers.

Stock indices such as the Dow Jones Industrial Average (DJIA) and the S&P 500 are essential features of the US stock market. The DJIA, composed of 30 significant companies, provides a snapshot of the market’s performance, while the S&P 500 includes 500 leading companies and offers a broader market perspective. These indices help investors gauge market trends and make informed investment decisions.

Economic indicators, fiscal policies, and geopolitical events influence the US stock market, which plays a critical role in the global economy. It serves as a platform for companies to raise capital by issuing shares to the public. Companies can use this capital for expansion, research, development, and other business activities that contribute to economic growth. In addition, global investors look to the US stock market for robust investment opportunities.

Basic terminologies such as’stocks,’ ‘bonds,’ and’market ‘capitalisation’ are fundamental to understanding the US stock market. Stocks represent ownership shares in a company, granting investors equity in the company’s earnings and assets. Bonds, on the other hand, are debt instruments through which investors lend money to corporations or governments in exchange for regular interest payments. Other investment vehicles include mutual funds, ETFs, and derivatives, each offering different risk-return profiles.

Understanding the dynamics of the US stock market is crucial for investors, whether they are novices or experienced traders. This section aims to provide a comprehensive introduction to its history, significance, and operations, laying the foundation for deeper exploration into its various facets.

Factors influencing the US Stock Market

Numerous factors influence the performance of the US stock market, each contributing in different ways to market trends and fluctuations. Economic indicators are one of the most important influences. Key metrics, such as Gross Domestic Product (GDP) growth, provide insight into the overall health and expansion of the economy. A robust GDP generally correlates with a bullish stock market, while stagnation or contraction can lead to bearish trends.

Interest rates, determined by the Federal Reserve, also play a critical role. When interest rates are low, borrowing becomes cheaper, potentially spurring economic activity and driving stock prices higher. Conversely, rising interest rates can increase borrowing costs, possibly cooling economic growth and leading to a decline in stock prices.

Inflation is another crucial factor. Moderate inflation is often indicative of a growing economy, but rampant inflation can erode purchasing power, leading to higher costs for companies and consumers alike, negatively impacting corporate profits and stock valuations. Employment figures similarly offer a gauge of economic strength. High employment typically supports consumer spending, which is vital for economic and stock market growth.

Corporate earnings reports are pivotal as they reflect the financial health of companies. Positive earnings often boost investor confidence and stock prices, while disappointing results can lead to market downturns. Geopolitical events, including trade wars, elections, and international conflicts, can introduce uncertainty, impacting investor sentiment and market stability.

Government policies, such as tax reforms and spending initiatives, also exert influence on the stock market. Pro-business policies may spur investment, whereas regulatory uncertainty can hinder market performance. Technological advancements drive innovation and productivity, often leading to sector-specific surges in stock prices.

Finally, we cannot undervalue the importance of investor sentiment and market psychology. Collective behavior often drives market trends, with optimism or fear leading to market rises or falls. Understanding these multifaceted influences provides a comprehensive view of what drives the US stock market, equipping investors with the knowledge to navigate its complexities.

Introduction to Lunar Calendar Chart Method

The Lunar Calendar Chart Method, though often underestimated, has a rich historical significance in various aspects of life, including financial market analysis. This method, based on lunar cycle observation, has long been used by cultures to predict natural and human activities. Historically, cultures have used lunar cycles to determine optimal planting seasons, navigate tides, and even anticipate market trends.

The moon’s phases, particularly the new moon and full moon phases, are central to the lunar calendar chart method. Researchers have observed that these lunar phases carry potential influences on human psychology and behavior, which could subsequently affect market activities. For instance, periods around the new moon are often thought to be conducive to new beginnings and optimism, potentially leading to increased buying behaviors. Conversely, full moon periods might trigger caution or pessimism, resulting in more conservative financial decisions or market sell-offs.

The idea that lunar cycles have an impact on human behavior has some roots in empirical research. Scholars in various fields, including psychology and astronomy, have explored the moon’s gravitational pull and its correlation with psychological states. These subtle shifts in human sentiment can sometimes manifest themselves in collective behaviours that drive market movements. Financial market analysts utilizing the Lunar Calendar Chart Method aim to map these cyclical patterns in hopes of gaining a predictive edge.

While this approach may seem esoteric, its application in financial market analysis is part of a broader tradition of examining cyclical phenomena to forecast economic activity. By integrating data on lunar phases with traditional stock market analysis, this method seeks to provide a more nuanced understanding of market behaviors. In doing so, it offers an intriguing perspective on the interconnectedness of natural cycles and economic trends.

The correlation between lunar phases and US Stock market trends

Over the years, various empirical studies and anecdotal evidence have pointed to a potential correlation between lunar phases and stock market trends. Several researchers have explored how lunar cycles, particularly new moons and full moons, can influence market behavior. Historical data suggests that these celestial events can indeed have a subtle yet detectable impact on stock prices, sometimes contributing to market gains or declines.

A number of scholarly studies have quantified the relationship between lunar phases and stock market performance. One such study found that stock returns tend to be abnormally high around new moons and relatively low around full moons. This phenomenon has been attributed to psychological factors, such as investor sentiment and market psychology, which are thought to be influenced by lunar phases. Although the exact mechanisms remain elusive, the statistical evidence is strong enough to warrant further investigation.

Traders and economists often use a variety of statistical methods and indicators to identify patterns linked with lunar phases. Techniques such as time-series analysis and Fourier transforms have been useful in isolating cyclical patterns in market data. Additionally, some financial models incorporate lunar cycle indicators as part of a broader strategy, leveraging the timing of new and full moons to optimise buy and sell decisions.

Despite the skepticism of the mainstream financial community, we cannot entirely dismiss the wealth of anecdotal evidence. Historical market records from different time periods and geographical regions show recurrent patterns that align with the lunar calendar. This convergence of folklore and statistical rigour offers a rich field for further academic inquiry and practical application.

In essence, although there is not universal acceptance of the correlation between lunar phases and market trends, the data sufficiently supports the notion to warrant consideration. It will be fascinating to see how traders and economists integrate lunar cycles into more comprehensive market analysis frameworks as they continue to study this intriguing relationship.

Case Studies: Past US Economic Recession Cycles and Lunar Calendar

Examining past US recessions through the lens of the lunar calendar yields fascinating insights into the potential predictive capabilities of this alternative method. Historical analysis reveals several instances where the alignment of economic recessions with lunar cycles is noteworthy. These case studies provide a comprehensive understanding of the application of the lunar calendar method to predict market downturns and recoveries, despite a range of successes and challenges.

A prominent case study is the 2008 financial crisis. In the years leading up to this significant economic downturn, researchers observed that certain lunar phases—notably the new moon—coincided with increased market volatility. Analysts in certain circles anticipated heightened risks around these periods. While this did not provide absolute foresight into the crisis, it underscored moments of caution preceding the downturn. Additionally, the re-emergence of market stability post-crisis corresponded with lunar phases, reinforcing a degree of predictive value.

Similarly, during the early 2000s dot-com bubble, the lunar calendar suggested cautionary signals. Researchers pointed to specific lunar phases where irrational exuberance was most prominent. The alignment highlighted an overvaluation in tech stocks and foreshadowed a correction, which later manifested as a major market collapse. Although the timing was not precise, the correlation between lunar phases and economic sentiment during this period provided a compelling case for consideration.

On the flip side, one must acknowledge the limitations inherent to this method. The 1987 Black Monday crash serves as an illustrative example where the lunar calendar offered limited predictive utility. Despite significant lunar phases, the abrupt market downturn was unforeseen within this framework, emphasizing the inherent unpredictability and multifaceted nature of economic phenomena.

Ultimately, these case studies highlight both the potential foresight and notable constraints of utilising the lunar calendar to predict economic recessions. While the lunar calendar can occasionally signal periods of caution or optimism, we should employ it as a supplementary tool rather than a standalone predictive measure.

Practical application and future implications on Recession Cycle & US Stock Market Analysis

Integrating the lunar calendar method into trading or economic forecasting strategies can provide a unique perspective for investors and analysts. One of the fundamental steps in this process is acquiring the right tools and resources. Contemporary software platforms and mobile applications offer lunar cycle tracking with precision. Examples include the Moon Phase Calendar and My Moon Phase, which provide detailed lunar phase information that can be paired with market data.

For practical application, it is advisable to create a historical correlation between lunar phases and market performance. This involves back-testing data to identify patterns and constructing models that illustrate potential market reactions during specific lunar phases. Investors should not rely solely on lunar phases, but rather use them as a supplementary tool. Integrating this method with other technical and fundamental analyses—such as moving averages, volume analysis, and economic indicators—enhances decision-making robustness.

Incorporating lunar cycles should involve a disciplined approach, considering both bullish and bearish phases and combining them with broader market trends. For example, traders might observe market positions during a full moon and confirm their insights through traditional methods like the Relative Strength Index (RSI) or candlestick patterns. This holistic strategy aids in minimising risks and identifying market opportunities with greater accuracy.

Future implications of the lunar calendar method in financial markets could be significant, especially with ongoing technological advancements. Artificial intelligence (AI) and machine learning (ML) are innovating market prediction models, and the lunar method can be a novel input in these systems. AI can identify more intricate patterns and generate higher accuracy predictions, thus potentially revolutionising the utility of lunar cycles in trading strategies.

Moreover, changing market dynamics in the context of globalisation and algorithmic trading accentuate the need for diverse analytical approaches. The lunar calendar method could evolve to accommodate this environment’s complexity, offering an additional layer of analysis to the increasingly sophisticated tools used by market participants. As market dynamics continue to evolve, the lunar calendar method’s role may grow, fostering new approaches in financial analysis and trading practices.

Decoding US Stock Market, recession and Economic Crunch Astrologically

I have used the following pointers and illustrated the principles with USA Recession Cycles Since 1960 Charts to demonstrate its application.

Principles:

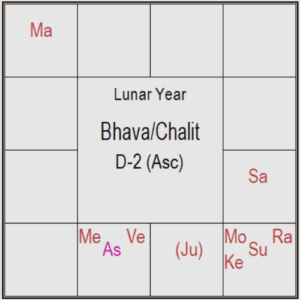
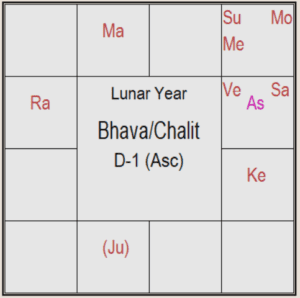
1) Rasi (D-1) Lagna Lord, 2nd Lord and their placement in Dushtana (6th, 8th or 12th) houses.

2) Hora (D-2) Lagna Lord, 2nd Lord and their placement in Dushtana (6th, 8th or 12th) houses.

3) Rahu and Ketu’s involvement and influence with the above 2 principles.

Note: I have used Pushya-Paksha Ayanamsa with Bhava/Chalit Charts in this analysis.

USA Recession-01: Apr 1960 to Feb 1961

* Lunar New Year: July 5, 1959, 22:01:05 (4 Hours West of GMT), Washington, DC (77 W 02′ 12″, 38 N 53′ 42″)

01 1 Determining US Stock Market and Economic Recession Cycles Using Annual Lunar Calendar Chart Method 01 2 Determining US Stock Market and Economic Recession Cycles Using Annual Lunar Calendar Chart Method

In Rasi Chart, the Lagna and 2nd Lord Saturn is placed in 12th house and being aspected by 8th lord Sun. Rahu and Ketu are aspecting Lagna Lord Saturn by Rasi Drishti.

In Hora Chart (D-2), 2nd lord Mars is placed in 12th house with 10th lord Moon and 11th Lord Sun. Mercury the 12th lord is placed in Lagna. Rahu and Ketu are aspecting the D-2 Lagna by Rasi Drishti. The Recession began during the Mars (2nd Lord in D-2) Vimsottari Dasa in April 1960.


USA Recession-02: Dec 1969 to Nov 1970

* Lunar New Year: July 14, 1969, 10:12:03 (4 Hours West of GMT), Washington, DC (77 W 02′ 12″, 38 N 53′ 42″)

02 1 Determining US Stock Market and Economic Recession Cycles Using Annual Lunar Calendar Chart Method  02 2 Determining US Stock Market and Economic Recession Cycles Using Annual Lunar Calendar Chart Method

In Rasi Chart, the Lagna is being afflicted by Rahu and Ketu. Lagna Lord Sun is with 2nd Lord Mercury and 12th lord Moon. Saturn is the 6th Lord and aspecting Lagna lord and 2nd Lord Mercury by 3rd aspect from Aries.

In Hora Chart (D-2), 2nd co-lord Rahu is with Ketu and being aspected by 8th lord Sun. The Recession began during the Ketu (with 2nd Lord Rahu in D-2) Vimsottari Dasa in November/December 1969.


USA Recession-03: Nov 1973 to Mar 1975

* Lunar New Year: July 30, 1973, 07:39:17 (4 Hours West of GMT), Washington, DC (77 W 02′ 12″, 38 N 53′ 42″)

03 1 Determining US Stock Market and Economic Recession Cycles Using Annual Lunar Calendar Chart Method  03 2 Determining US Stock Market and Economic Recession Cycles Using Annual Lunar Calendar Chart Method

In Rasi Chart, the Lagna lord Moon, 2nd Lord Sun, 8th Lord Saturn are placed in 12th house along with Ketu and all these are being aspected by Rahu.

In Hora Chart (D-2) 2nd lord Jupiter is placed in 12th house. 12th Lord Venus and 8th lord Mercury are placed in Lagna. The Recession began during the Jupiter (2nd Lord in D-2) Vimsottari Dasa in July 1973.


USA Recession-04: Jan 1980 to July 1980

* Lunar New Year: June 24, 1979, 07:58:31 (4 Hours West of GMT), Washington, DC (77 W 02′ 12″, 38 N 53′ 42″)

04 1 Determining US Stock Market and Economic Recession Cycles Using Annual Lunar Calendar Chart Method    04 2 Determining US Stock Market and Economic Recession Cycles Using Annual Lunar Calendar Chart Method

In Rasi Chart, the Lagna Lord Moon and 2nd Lord Sun are placed in 12th house. 12th Lord Mercury and 6th Lord Jupiter are placed in Lagna. Ketu is aspecting Lagna by Rasi Drishti.

In Hora Chart (D-2), 2nd lord Jupiter is placed in 12th house. 8th Lord Mercury is placed in Lagna. Rahu and Ketu are aspecting Lagna by Rasi Drishti.


USA Recession-05: July 1981 to Nov 1982

* Lunar New Year: July 1, 1981, 15:03:41 (4 Hours West of GMT), Washington, DC (77 W 02′ 12″, 38 N 53′ 42″)

05 1 Determining US Stock Market and Economic Recession Cycles Using Annual Lunar Calendar Chart Method   05 2 Determining US Stock Market and Economic Recession Cycles Using Annual Lunar Calendar Chart Method

In Rasi Chart, the Lagna Lord Venus is placed in 10th house with Rahu. 2nd Lord Mars is placed with 12th Lord Mercury in 9th house.

In Hora Chart (D-2), 2nd lord Venus is placed in 8th house with Rahu and Ketu. The recession began in Rahu Vimsottari Dasa in July 1981.


USA Recession-06: July 1990 to Mar 1991

* Lunar New Year: June 22, 1990, 14:55:10 (4 Hours West of GMT), Washington, DC (77 W 02′ 12″, 38 N 53′ 42″)

06 1 Determining US Stock Market and Economic Recession Cycles Using Annual Lunar Calendar Chart Method  06 2 Determining US Stock Market and Economic Recession Cycles Using Annual Lunar Calendar Chart Method

In Rasi Chart, the Lagna Lord Mercury is with 12th Lord Sun. 2nd Lord Venus is placed in 8th house. Rahu is aspecting the Lagna Lord Mercury by Rasi Drishti.

In Hora Chart (D-2), 2nd lord Jupiter is placed in 8th house. The recession began in Rahu Vimsottari Dasa in June 1990.


USA Recession-07: Mar 2001 to Nov 2001

* Lunar New Year: July 1, 2000, 15:20:28 (4 Hrs west of GMT), Washington, DC (77 W 02′ 12″, 38 N 53′ 42″)

07 1 Determining US Stock Market and Economic Recession Cycles Using Annual Lunar Calendar Chart Method  07 2 Determining US Stock Market and Economic Recession Cycles Using Annual Lunar Calendar Chart Method

In Rasi Chart, the Lagna Lord Venus is with 12th lord Mercury. 2nd Lord Mars is placed with 12th Lord Mercury, 8th Lord Venus in 9th house.

In Hora Chart (D-2), 2nd lord Venus (Debilitated) is placed in 6th house. Rahu and Ketu are aspecting Lagna by Rasi Drishti. The recession began in Venus Vimsottari Dasa in Mar 2001.


USA Recession-08: Dec 2007 to June 2009

* Lunar New Year: July 14, 2007, 08:04:24 (4 Hours West of GMT), Washington, DC (77 W 02′ 12″, 38 N 53′ 42″)

08 1 Determining US Stock Market and Economic Recession Cycles Using Annual Lunar Calendar Chart Method  08 2 Determining US Stock Market and Economic Recession Cycles Using Annual Lunar Calendar Chart Method

In Rasi Chart, the Lagna Lord Moon is in 12th with 12th lord Mercury. 2nd Lord Sun is also placed in 12th house with 12th Lord Mercury.

In Hora Chart (D-2), 2nd lord Mars is placed in 8th house. Rahu and Ketu are aspecting 2nd Lord Mars by Rasi Drishti. The recession began in Ketu Vimsottari Dasa in December 2007.

Conclusion

We saw how effectively we could use the Annual Lunar Calendar Chart prepared for a given Year for a Country with the principles laid out in the beginning of this article in determining the recession cycles. I sincerely hope my fellow Astrologers will continue to work with these principles, expand these principles and then to help People and Business Organization to prepare for the upcoming recession cycle(s).


References

1) Article “Re-defining the Lunar New Year Chart” by Sri. P.V.R. Narasimha Rao, December 3, 2014 (version 1) :

    http://vedicastrologer.org/articles/pp_lunar_year.pdf

2) USA National Bureau of Economic Research: http://www.nber.org/cycles.html

3) USA Recession Cycle Periods from https://en.wikipedia.org/wiki/List_of_recessions_in_the_United_States


***

pin Determining US Stock Market and Economic Recession Cycles Using Annual Lunar Calendar Chart Method

Views: 45